Use of Food Stamps Rises in Winona CountyBy Emily Guerin and Tim Marema The use of food stamps in Winona County increased during the recession, assisting families in stretching their food dollars, contributing to local spending and helping spark a national debate about the future of the federal nutrition program.
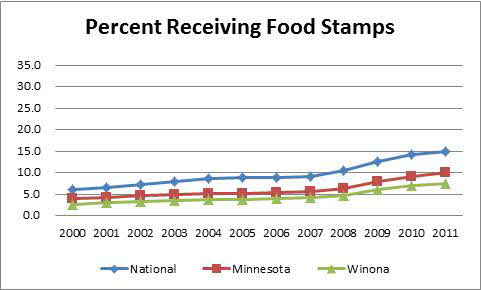
The proportion of Winona County residents receiving food stamps hit 7.4 percent in 2011, according to the U.S. Department of Agriculture (USDA) Food and Nutrition Services. That’s an increase of 3.1 percentage points since 2007, the year the recession started.  |
Winona County's food-stamp usage rate is lower than the state rate. Across Minnesota, 10.0 percent of residents in 2011 received support from the Supplemental Nutrition Assistance Program (SNAP), as the food stamp program is officially known. Nationally, 14.8 percent of the population receives SNAP benefits.
Places like Winona County, which are located outside metropolitan areas, tend to have a higher percentage of the population receiving SNAP benefits. That’s because incomes are generally lower in nonmetropolitan counties.
The inflation-adjusted median household income in Winona County in 2011 was $47,672, compared to the Minnesota median of $58,978. Nationally, median household income was $52,306 in 2011.
In 2011, residents of Winona County received a combined $5,181,674 in SNAP benefits. The USDA reports that each $5 in SNAP benefits generates $9.20 in spending.
SNAP benefits start to circulate in the economy quickly. Participants spend nearly all their food stamps within one month of receipt, according to a study by the University of New Hampshire Carsey Institute.
Grocers say they feel the impact of SNAP and other USDA nutrition programs like Women, Infants and Children (WIC).
“Without SNAP and WIC, we wouldn’t be able to make it,” wrote the owner of the Mill City Market in the small town of Mill City, Ore., in a survey of rural grocers conducted by the Oregon Food Bank and Kansas State University Rural Grocery Initiative. Owners know they have to stock the shelves to prepare for more business when SNAP benefits hit the streets, said David Procter with the Rural Grocery Initiative
It’s not just the mom-and-pop stores that see a bump from food-stamp spending in small towns and rural areas. Walmart reported in a recent Securities and Exchange Commission filing that a decrease in SNAP benefits last year could affect the retail giant’s bottom line.
Average SNAP benefits nationally fell about $30 a month per family in November after a temporary increase that was part of the 2009 economic stimulus package. More funding decreases are on the way.
This summer, Congress agreed to trim about $8 billion from SNAP over the next decade. Backers of the cuts said the program had expanded too much in recent years and was creating too much reliance on government assistance. SNAP expenditures increased 135 percent between 2007 and 2011.
U.S. Rep. Eric Cantor (Va.-R) backed a measure that would have removed SNAP from the farm bill entirely.
“While [SNAP] is an important part of our safety net, our overriding goal should be to help our citizens with the education and skills they need to get back on their feet so that they can provide for themselves and their families,” Rep. Cantor said during congressional debate.
Food stamps have been part of the farm bill for the past 50 years. The legislation’s combination of farming and nutrition programs has helped ensure the bill receives broad backing from farm-country representatives and more urban-based members who support anti-poverty programs.
That alliance was tested but held with the passage of the 2014 farm bill.
Data for this article came from USDA Food and Nutrition Services, the Bureau of Economic Analysis and the U.S. Census. The data was compiled and analyzed by Roberto Gallardo, Ph.D., associate Extension professor with the Mississippi State University Extension Service. Funding for this report came from the W.K. Kellogg Foundation and the John S. and James L. Knight Foundation. The Daily Yonder (www.dailyyonder.com) is an independent rural news site published by the nonprofit, nonpartisan Center for Rural Strategies.
| 